In our modern world, development of new synthetic compounds and chemicals is essential for many industries, such as the pharmaceutical, clothing and food industries. This has become a major public and environmental issue as many of these compounds can be toxic and detrimental to human and animal health. In addition to these artificial toxins, chemicals can occur naturally in the environment such as heavy metals or nitrates. Although it is widely recognised that such compounds can cause damage to life, how harmful they are and how they cause disease needs to be evaluated based on toxicology studies. Whether it is drug screening essays or ecotoxicology studies, zebrafish are valued as a system to assess toxic effects of synthetic and natural compounds.
Throughout our previous articles, we have mentioned numerous times the advantages zebrafish represent as an animal model for biological research. Not only are they small, easy to bread and maintain and have a strong conservation with humans1, zebrafish embryos and young adults are optically transparent, allowing direct observation of internal organs and morphological characteristics by light or fluorescent microscopy2. In this article we will discuss some common techniques used to observe zebrafish eggs and embryos and different phenotypes which can be used as parameters to assess toxic effects of chemical compounds.
Bright field versus fluorescence imaging
Bright field microscopy is a simple optical microscopy illumination technique used to illuminate and magnify biological samples. This technique relies on a simple light pathway which transmits a white light through the sample. The light is absorbed differently throughout the specimen according to different density areas3. The light attenuation causes contrast and generates an image of a dark object on a bright background. This type of microscopy is very popular as it only requires a light-microscope setup and can image live biological samples. However, it also bears several limitations such as low contrast, limited magnification and low resolution.
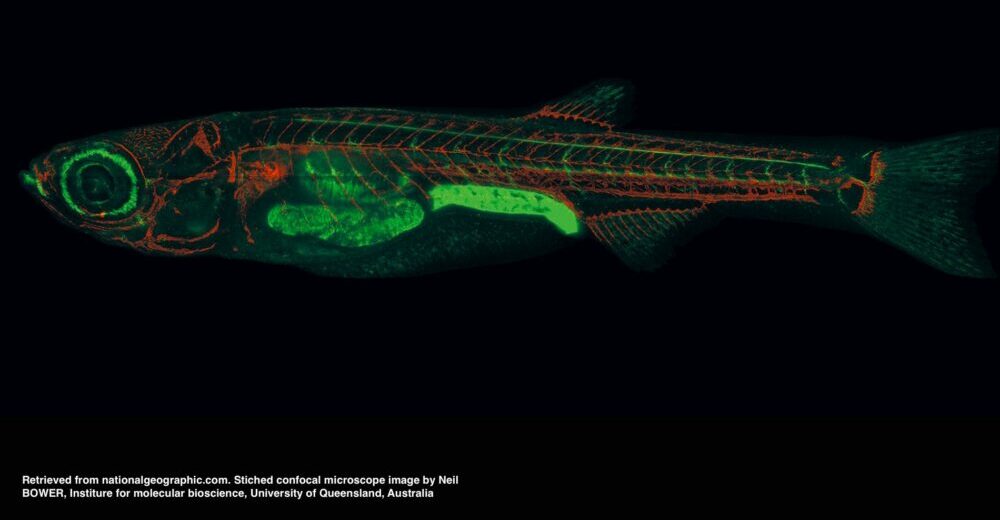
Fluorescence microscopy is an optical microscopy technique which uses fluorophores and filters in addition to a conventional light microscope setup3. This technique relies on light absorption and emission by a fluorophore. Fluorophores can be fluorescent dyes or fluorescent proteins which mark molecular structures or mechanisms. Fluorescent dyes have a higher photostability and brightness compared to fluorescent proteins. However, the dyes themselves aren’t very fluorescent and need to bind other proteins to become detectable. Fluorescent proteins on the other hand become fluorescent without any additional molecules when they absorb the right light wavelength4. Green Fluorescent Protein (GFP) is a common protein used to localise proteins, observe protein interactions and quantify gene expression.
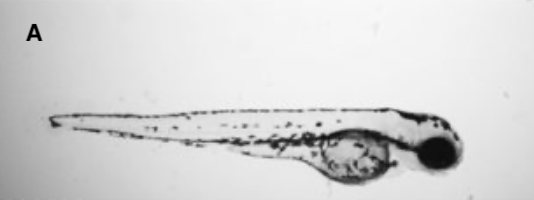
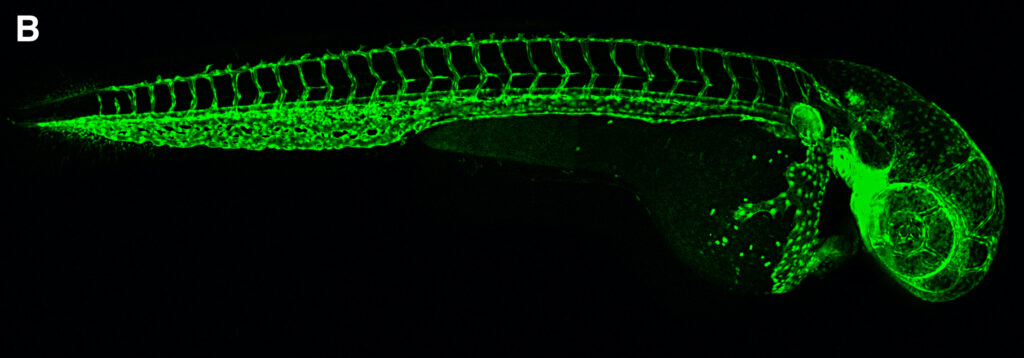
Figure 1: (A) Zebrafish embryo under a bright field microscope5. (B) Zebrafish embryo under a fluorescent microscope6.
GFP is a well-known protein by biologists and frequently used in cell and molecular biology as a reporter of gene expression. The protein is naturally found in marine organisms and was initially isolated from the jellyfish Aequorea victoria. GFP has a main excitation peak at 396 nm (UV light) and an emission peak at 509 nm which is in the lower end of the green portion of the visible spectrum7.
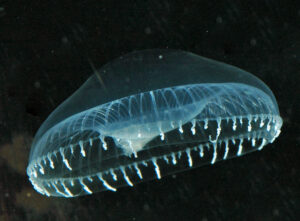
Figure 2: Aequorea Victoria. This jellyfish species naturally expresses GFP8.
Although fluorescence microscopy seems to override bright field microscopy when it comes to contrast and resolution quality, bright field microscopy remains a valued imaging technique for zebrafish experimentation. Indeed, their optical clearness makes them nearly transparent under the bright-field microscope allowing visual analysis of developing embryos9. Environmental and toxicology studies particularly rely on zebrafish eggs and embryos to assess toxic effects of chemical compounds on developmental patterns and observe resulting phenotypes9. Other experiments which aim to track various cell types, monitor molecular pathway regulations or label intracellular organelles will preferer fluorescence imaging10.
Morphological and phenotypic characteristics
As zebrafish remain transparent throughout the majority of their development, it is easy to observe variations in morphological traits and phenotypes. Moreover, during organogenesis zebrafish are permeable to small molecules and synthetic compounds, making drug administration easy2. Drug discovery and toxicology studies rely on phenotype-based screens to assess drug effects on growth and development. Typically, visual examination under a microscope of body length and shape, size and morphology of internal organs such as the brain, liver, cardiovascular system, cartilage, notochord, pancreas, intestine and kidneys is used to determine effects of pharmaceuticals or toxins2.
Developmental toxicities include common morphological changes such as curved tail and trunk, coagulation in the yolk sac and modified heartbeat11,12. For instance, acetaminophen, also known as paracetamol, is known to cause tail, heart and yolk sac malformations in zebrafish13. The deformities caused by the drug on zebrafish embryos are dose-dependent and occur at different stages of development14. High doses of acetaminophen cause lethal impairments such as yolk sac malformation, whereas lower doses lead to pigmentation abnormalities or tail malformations14. Additionally, all drug-exposed fish have a lower body mass and length compared to non-exposed fish, independently of the administered dose14.
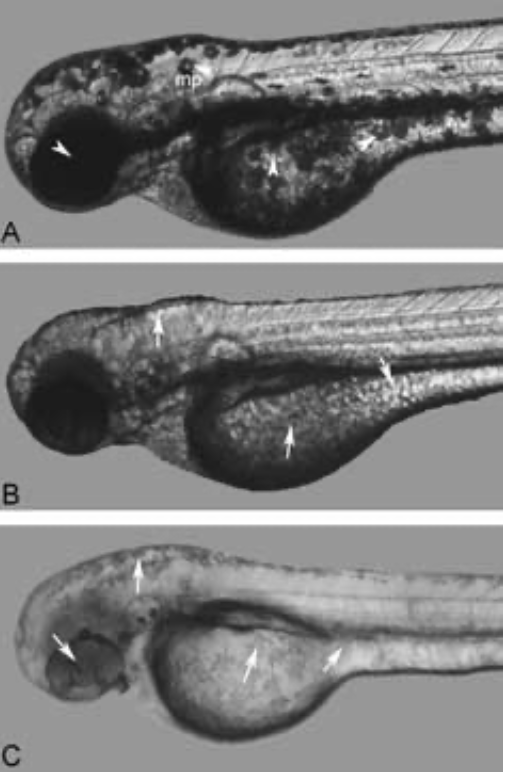
Figure 3: Effects of acetaminophen on pigmentation in zebrafish larvae. (A) is a control and arrows indicate abundance of pigmentation in the head, yolk sac and trunk. (B) and (C) were administered increasing doses of the drug and pigmentation is reduced.14
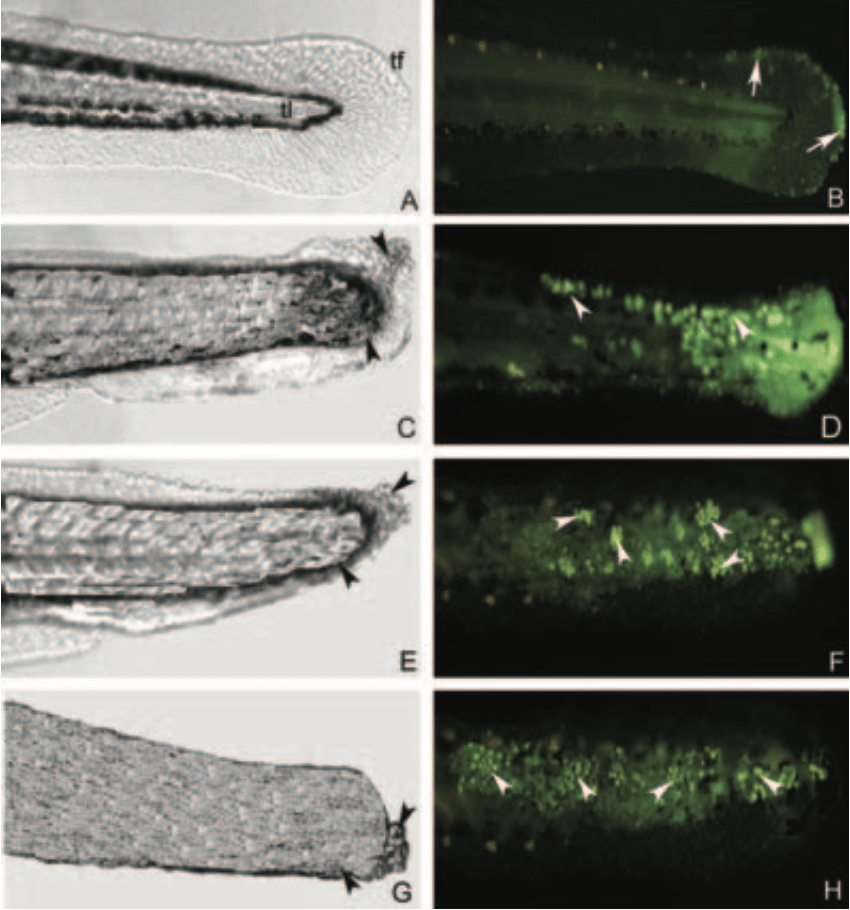
Figure 4: Effects of acetaminophen on zebrafish tail morphology. (A) and (B) are controls. (C) and (D), (E) and (F), (G) and (H) received increasing does of the drug. Deformities in the tail region increase according to the dose of acetaminophen received.14
Another interesting phenotype to look out for in toxicity screens is cardiac functions and particularly heart rate variability. Cardiac parameters within zebrafish embryos can reveal cardio-toxic and neurotoxic effects of pharmaceutical and toxic compounds12. Simple heart-rate measurement in zebrafish can provide predictive information regarding interactions of chemicals with the components of the cardiac functional regulatory network15. These parameters can also be useful to study developmental and physiological aspects within the cardiovascular system as heart development is a very sensitive process which can be affected by early exposure to toxic molecules15.
One last toxicology endpoint we will discuss is zebrafish egg coagulation. Coagulation occurs rapidly during development, generally at 24 hours post fertilisation. Thus, coagulation is the first parameter which can be observed and assessed during a toxicity screen. Coagulation occurs as a result of reduced blood flow, development delay and gastrulation arrest which are all considered as sublethal endpoints16. Coagulated eggs are an indicator of dead zebrafish embryos and should be discarded.
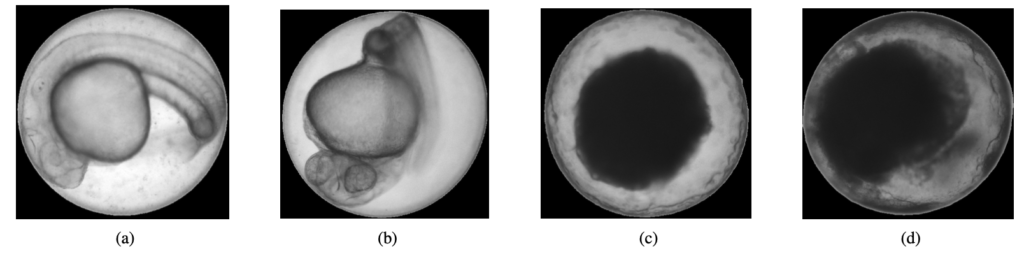
Figure 5: Zebrafish eggs. (a) and (b) are live eggs. (c) and (d) are coagulated dead eggs17.
Biomarkers
Although a lot of zebrafish experiments rely solely on visual assessment of pure morphological features of developing embryos, when it comes to understanding molecular pathways, organ physiology and track tissue specific proteins, observation needs to be facilitated by a fluorescent biomarker. Biological markers are measurable indicators of some biological or pathogenic process, or pharmacological response to a therapeutic molecule. Here we will discuss applications of fluorescent proteins as they are commonly used to generate transgenic lines of zebrafish. Cells of interest are labelled using a tissue specific promoter to drive the expression of a fluorescent protein18.
GFP and mCherry are two commonly used fluorescent proteins for live tissue imaging. By fusing the chosen biomarkers to tissue specific proteins, cells and tissues of interest will fluoresce green if using GFP or red if using mCherry. For instance, both GFP and mCherry have been used to observe and image collagen deposition during skin development and repair in transgenic zebrafish lines19. Zebrafish are indeed an ideal model to observe in vivo dynamic processes. Moreover, zebrafish coupled to fluorescent imaging techniques have become a popular system to follow tumour formation. Some studies have been able to image xenograft transplants, neovascularisation, growth responses to treatments and self-renewal using fluorescent proteins. Most experimental models have used GFP or red fluorescent proteins to distinguish tumour cell subpopulations thanks to their spectral differences10. However, several other fluorescent protein variants are available for cancer imaging in zebrafish.
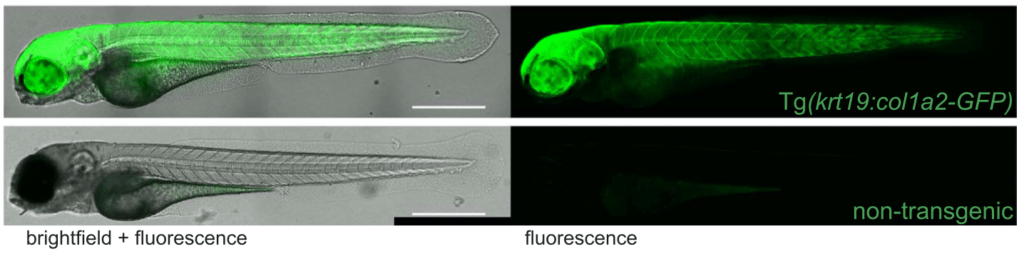
Figure 6: Transgenic GFP-labelled collagen I zebrafish line19.
When it comes to zebrafish experimentation, appropriate imaging techniques are essential to analyse and visualise experimental outcomes. Whether it is toxicology or drug screening assays, biological and genetic research or human disease modelling, all investigate abnormal phenotypes developing as a result of the experimental design. These phenotypes are assessed by means of microscopy techniques which can be associated to automated sorting techniques to increase throughput of the study. Therefore, full understanding of expected phenotypes along with appropriate biomarkers and imaging techniques are an important part of any setup. For more information on automation and high-throughput screening, have a look at our previous article: High-throughput screening and automation technologies for zebrafish assays.
References
- Parng, C., Seng, W. L., Semino, C. & McGrath, P. Zebrafish: A Preclinical Model for Drug Screening. ASSAY Drug Dev. Technol. 1, 41–48 (2002).
- Kari, G., Rodeck, U. & Dicker, A. P. Zebrafish: An Emerging Model System for Human Disease and Drug Discovery. Clin. Pharmacol. Ther. 82, 70–80 (2007).
- How Fluorescence Microscopy Works – CH. http://www.thermofisher.com/uk/en/home/life-science/cell-analysis/cell-analysis-learning-center/molecular-probes-school-of-fluorescence/imaging-basics/fundamentals-of-fluorescence-microscopy/how-fluorescence-microscopy-works.html.
- Amersham pharmacia biotech. Fluorescence Imaging Principles and Methods. Retrieved November 10th, 2020. http://www.bu.edu/picf/files/2010/10/Fluor-ImagingPrinciples.pdf
- Crittenden, F. et al. Inhibition of SULT4A1 Expression Induces Up-Regulation of Phototransduction Gene Expression in 72-Hour Postfertilization Zebrafish Larvae. Drug Metab. Dispos. Biol. Fate Chem. 42, (2014).
- Important clue to how the circulatory system is wired. https://phys.org/news/2013-11-important-clue-circulatory-wired.html.
- Tsien, R. Y. THE GREEN FLUORESCENT PROTEIN. Annu. Rev. Biochem. 67, 509–544 (1998).
- Aequorea victoria. Wikipedia (2020).
- Shang, S., Long, L., Lin, S. & Cong, F. Automatic Zebrafish Egg Phenotype Recognition from Bright-Field Microscopic Images Using Deep Convolutional Neural Network. 12 (2019).
- Ignatius, M. S. & Langenau, D. M. Fluorescent Imaging of Cancer in Zebrafish. in Methods in Cell Biology vol. 105 437–459 (Elsevier, 2011).
- Nishimura, Y. et al. Using zebrafish in systems toxicology for developmental toxicity testing: Zebrafish and developmental toxicity. Congenit. Anom. 56, 18–27 (2016).
- De Luca, E. et al. ZebraBeat: a flexible platform for the analysis of the cardiac rate in zebrafish embryos. Sci. Rep. 4, 4898 (2015).
- Jeanray, N. et al. Phenotype Classification of Zebrafish Embryos by Supervised Learning. PLoS ONE10, (2015).
- David, A. & Pancharatna, K. Effects of acetaminophen (paracetamol) in the embryonic development of zebrafish, Danio rerio. J. Appl. Toxicol. 29, 597–602 (2009).
- Sarmah, S. & Marrs, J. A. Zebrafish as a Vertebrate Model System to Evaluate Effects of Environmental Toxicants on Cardiac Development and Function. Int J Mol Sci 16 (2016).
- von Hellfeld, R., Brotzmann, K., Baumann, L., Strecker, R. & Braunbeck, T. Adverse effects in the fish embryo acute toxicity (FET) test: a catalogue of unspecific morphological changes versus more specific effects in zebrafish (Danio rerio) embryos. Environ. Sci. Eur. 32, 122 (2020).
- Tharwat, A., Gaber, T., Fouad, M. M., Snasel, V. & Hassanien, A. E. Towards an Automated Zebrafish-based Toxicity Test Model Using Machine Learning. Int. Conf. Commun. Manag. Inf. Technol. ICCMIT2015 65, 643–651 (2015).
- Beretta, C. A., Dross, N., Engel, U. & Carl, M. Tracking Cells in GFP-transgenic Zebrafish Using the Photoconvertible PSmOrange System. J. Vis. Exp. JoVE (2016) doi:10.3791/53604.
- Morris, J. L. et al. Live imaging of collagen deposition during skin development and repair in a collagen I – GFP fusion transgenic zebrafish line. Dev. Biol. 441, 4–11 (2018).